
So just as many have felt that there is way too much information in a single Feltron Report, I too feel that there is a lot to digest when looking at one of these reports. In each one of the pages there is a ton of information that you must make sense of and you must look at a page for a couple of minutes to really get what the page is trying to tell you. Take for example the following page of the 2009 Feltron Report.
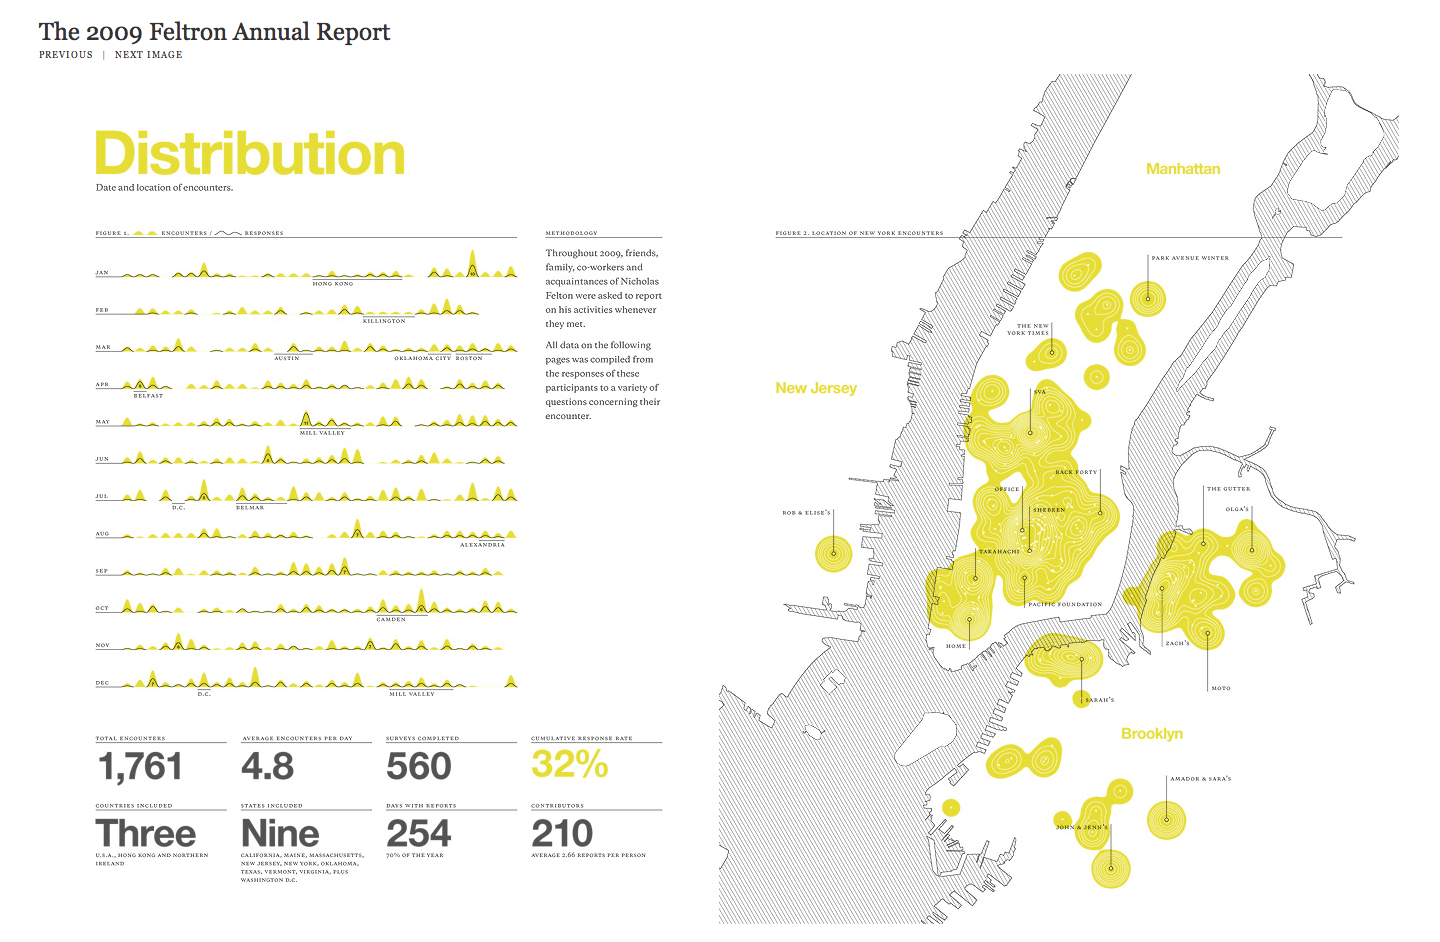
When you first look at this page you immediately wonder what is all of the information that is being reported on this page and what is its significance. This is a page that you must look at for a couple of minutes to really understand the information that is being reported. Once you know about the information that is being reported you can then look at this same page with a little more understanding and make sense of it. Initially it is just not very appealing to the eye and you have to zoom in to see everything that was reported in this page. It was the designer’s intent to make the report in this manner which is the reason why it is so visually unpleasant and requires time to really understand the information that is on this report.
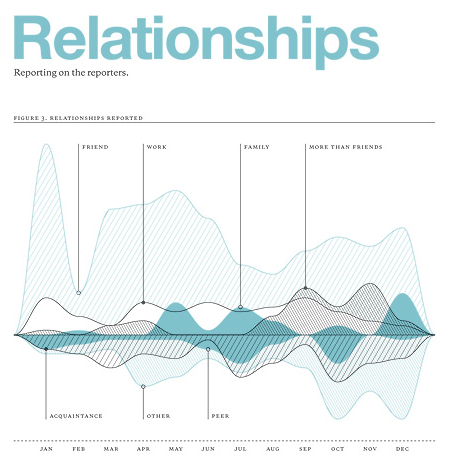
Not all of the report was bad. I felt that the following graph was well put together and was easy to read. The colors and lines that were used to compile the information that was gather was well put together. This graph is also easy on the eyes and you can easily distinguish one line of information from the other. The only problem that I had with this graph was the amount of relationships that were actually reported by the peaks of each line. If there would have been a set of numbers on the left hand side of the graph this graph could have been more powerful in making the information gathered easier to read.
The 2010/2011 Feltron Biennial Report is a bit overwhelming. There is so much information that is reported. One can’t help but to wonder if the person that is reporting all of this information has anything to do during the day other than taking notes of what they are doing. If I happened to be interested in what this individual was doing I think that this report would be extremely effective in reporting those details. The only problem that I have with this report is that there is too much information in such a small space. Maybe this report was designed in this manner with the purpose of cramming so much information in such a small space to cue the viewer that there is a lot of information here. The viewer of this report will have to make sense of the information just like in all of the other Feltron Reports.
I felt that the following graph was well put together and was easy to read.
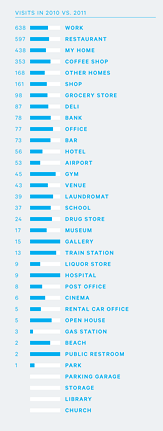
The information that was being reported in this particular graph was very easy to read and what I liked most about this graph was that you can immediately tell that there are two distinct numbers that are being reported for each place that was visited. Unfortunately there was only one number that was reported so you are left to wonder what if the difference is the number that was given or was that number for a particular year. What would have made this graph more powerful would have been to put both numbers of each each year. On the left 2010 and on the right 2011. The colors that were used were also easy on the eyes. When comparing two different things in a graph it is important that there are two distinct colors that are easy to tell apart.
I do not believe that I will ever gather so much information about myself and those around me. The information that was complied in the Feltron reports is just overwhelming and it really makes you wonder why would anyone gathered so much information about themselves. What would be the purpose for so much information and is there something to gain from gathering all of this information. These are some of the questions that I have about the Feltron Reports and I am willing to bet that for many who read these reports for the first time they might ask similar questions.